A consumer product asked to
act like enterprise software.
When I joined SurveyMonkey in 2016, the enterprise story was more ambition than reality. Sales had been scaled back, the product couldn't support the teams it was being sold to. There was no real admin console, no way to manage users at scale, no collaboration infrastructure. Teams of 25 were being onboarded into a product built for individuals.
The opportunity was clear. So was the gap. My job, from day one, was to build the design foundation that would let enterprise sales scale again, and then to grow with the product as that foundation proved out over four years.
I operated as area lead across the enterprise product surface, sitting on the design leadership council and working peer-to-peer with managers, senior managers, and directors across the org. I managed one designer directly and led design direction across a broader cross-functional team.
Building the admin console
nobody planned for.
The admin console redesign wasn't on the roadmap. It was widely considered too large an effort. In 2016, SurveyMonkey had roughly 50 enterprise customers and a largest team size of around 1,000, but the admin area serving them was outdated, non-responsive, not internationalized, and built on legacy tech that made every new feature a lift.
I made the case to do it anyway, and compressed the work into a focused three-month sprint: August to November 2016.
Three constraints that shaped everything
Not on the roadmap
I had to advocate for the work to exist, then deliver it quickly enough that it didn't become a risk to other priorities.
Design system in formation
The company-wide design system was still being built. We became the first team to adopt it, defining and contributing to it simultaneously.
Mobile & international from day one
Many admins start their journey from an email notification on their phone. Every primary flow had to work globally, across viewports and languages.
The information architecture
Before any UI, I mapped the full admin IA, accounting not just for what existed but what was on the roadmap and in the vision. This became a shared source of truth for product and engineering, and a framework we used for years after.
People management
The people management surface was the most used and most broken part of the admin console. We rebuilt it as a robust data table with rich filtering, bulk selection, inline actions, and drill-down to individual profiles. The full design story is covered in the Collaboration section below, where the table and the peer-facing People Pages are shown together.
The HTML prototype
Sketch couldn't do what we needed for the admin navigation. We had to test responsive behavior, international text expansion, wayfinding across a deep IA, and breadcrumb logic across real devices. So we built the prototype in HTML and CSS, using the emerging design system as the code base.
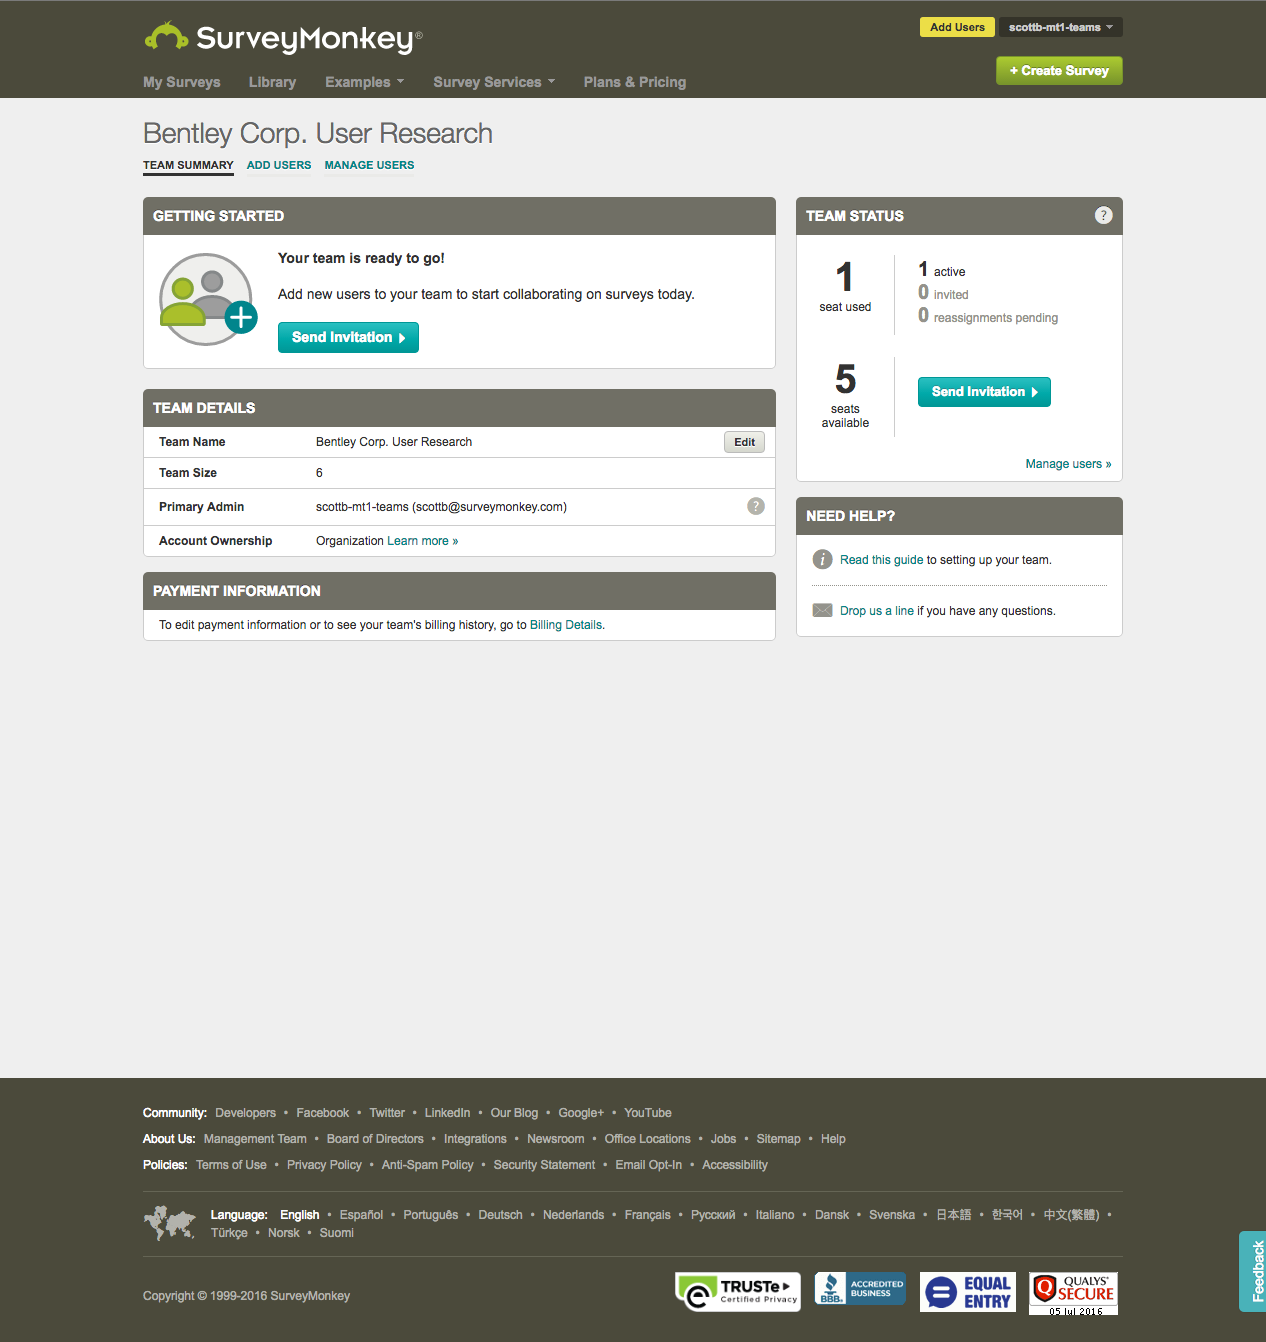
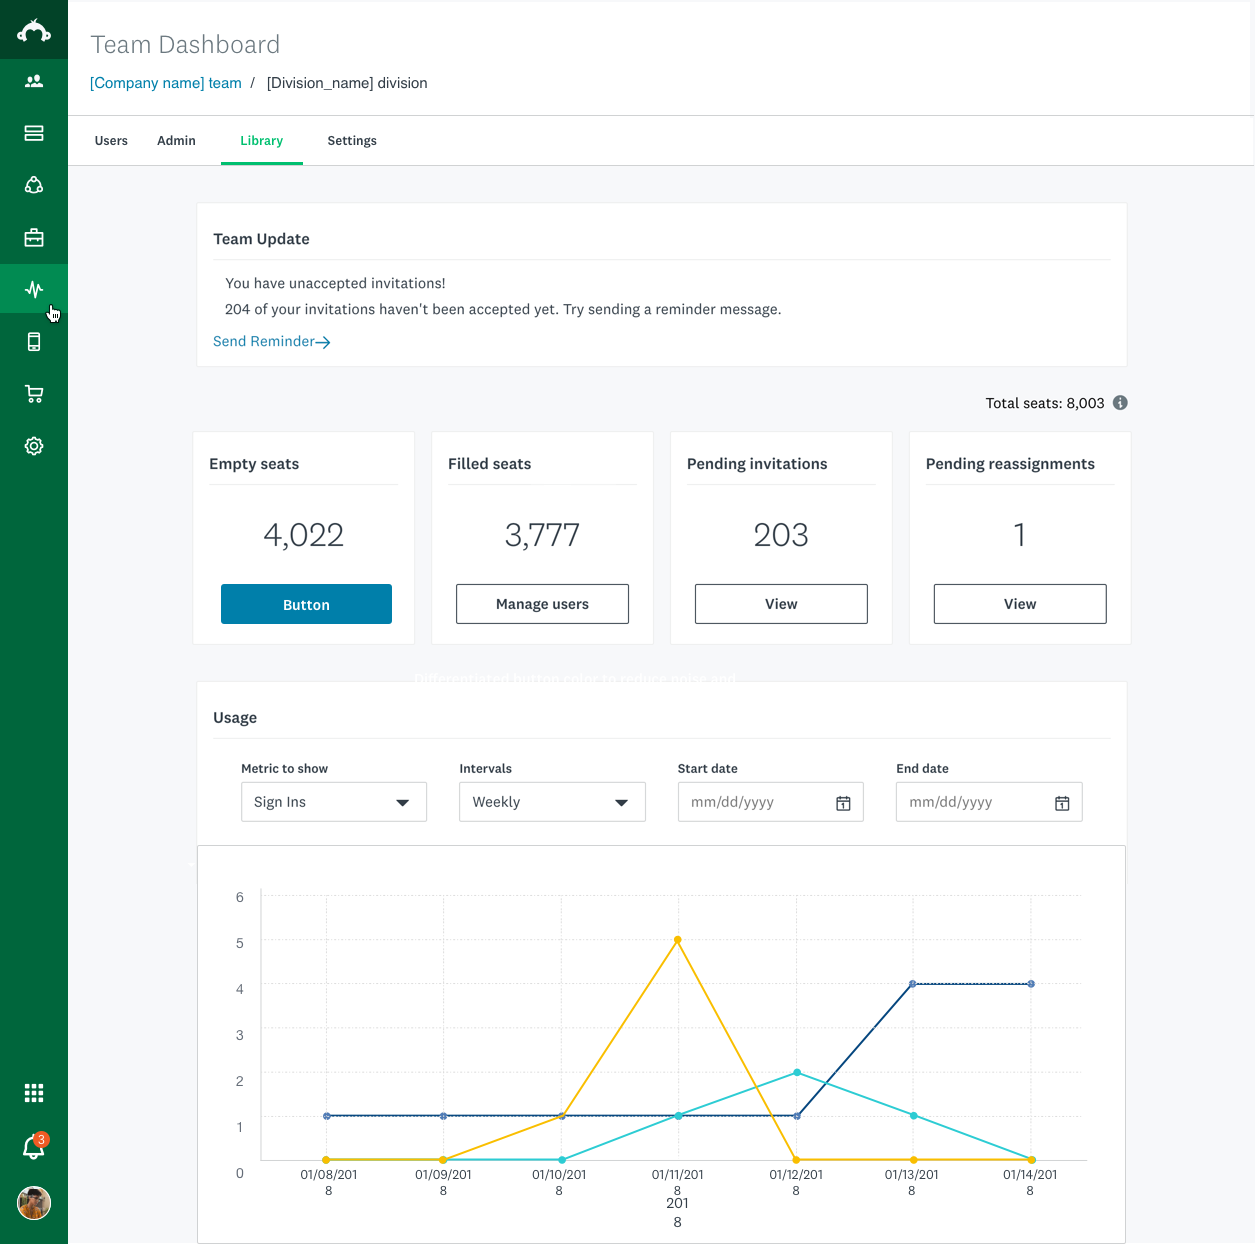
Drag to compare — legacy admin (2016) vs. redesigned console. The "before" couldn't scale past a few dozen enterprise customers.
The prototype wasn't just a testing tool; it became the engineering handoff. Because it was built on the actual design system code, we went from prototype directly to production with minimal translation loss. We were the first team at SurveyMonkey to adopt the design system across pillars, and the admin console established the pattern other teams followed.
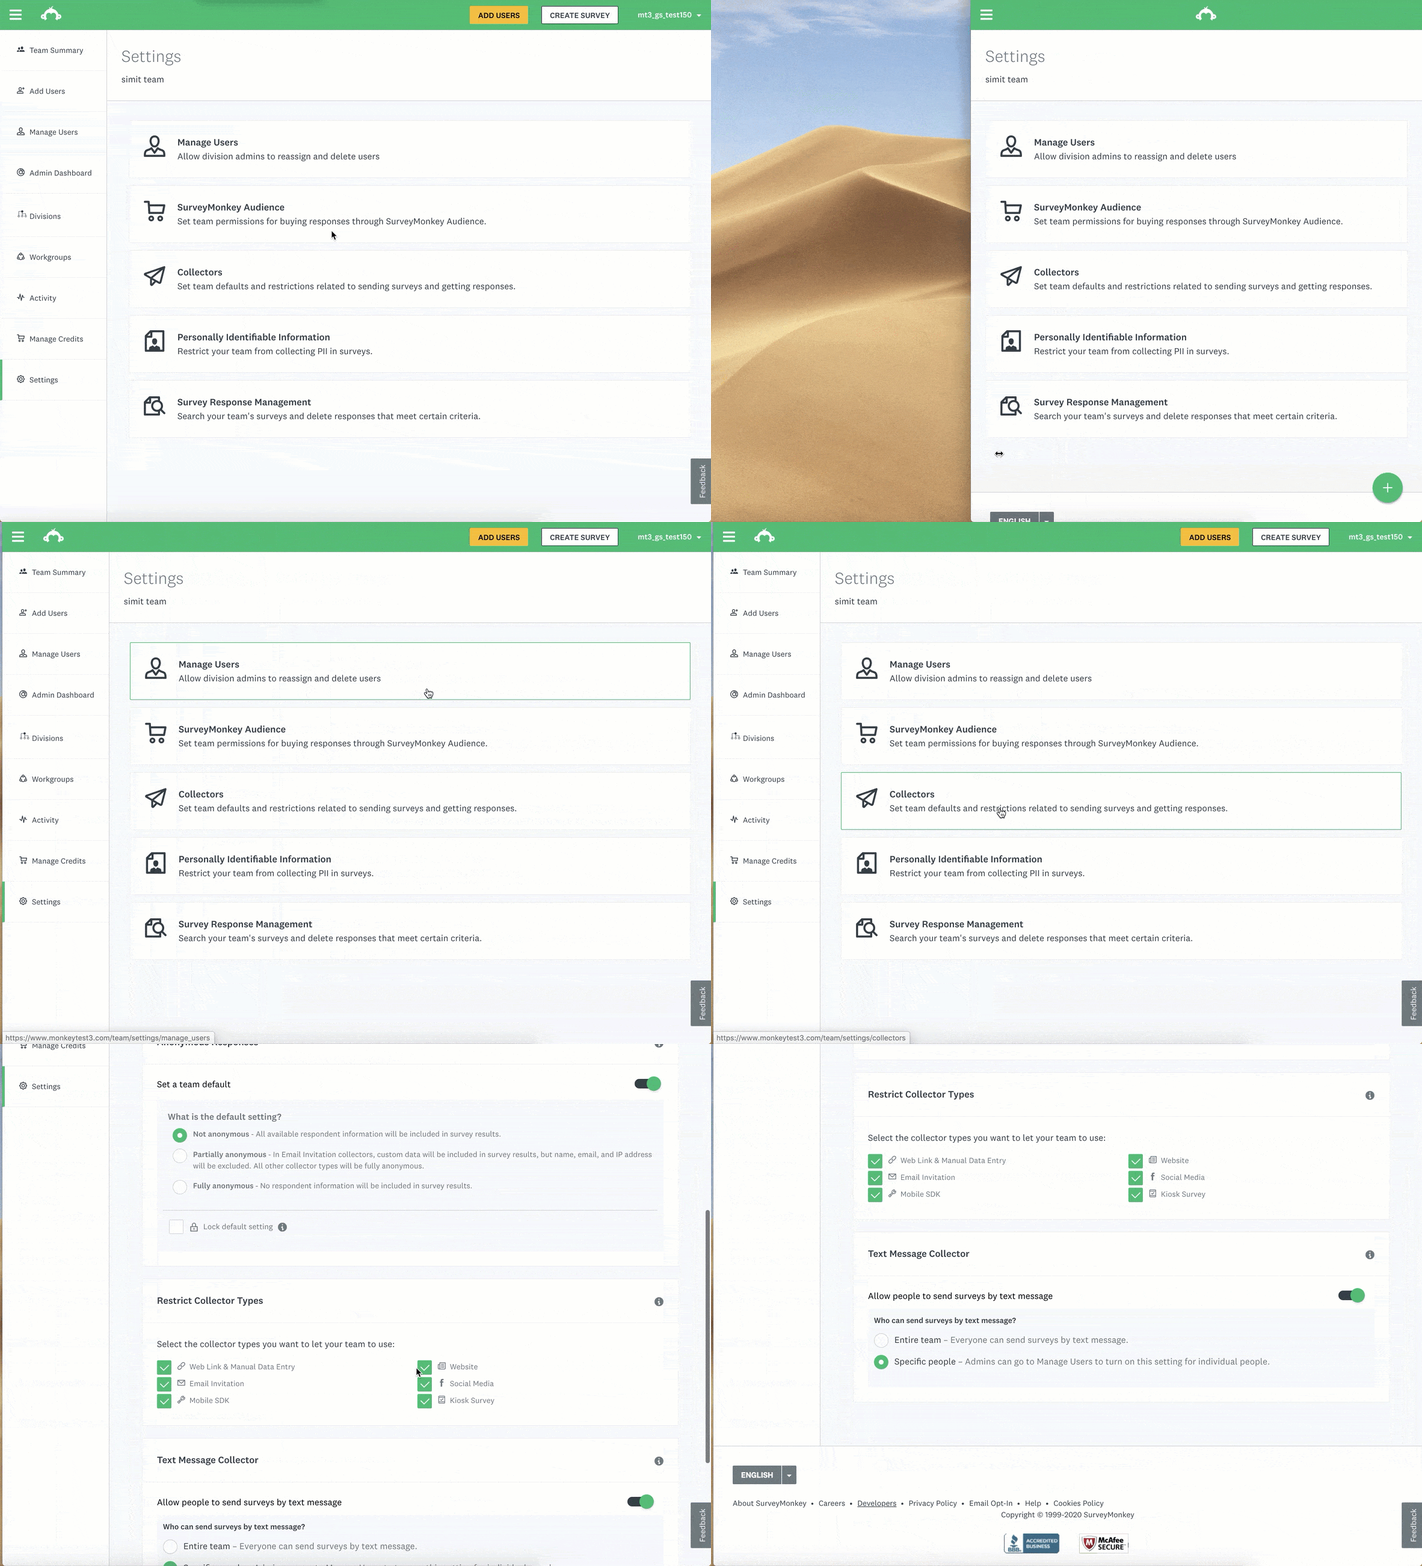
HTML/CSS prototype — Settings, built on the live design system
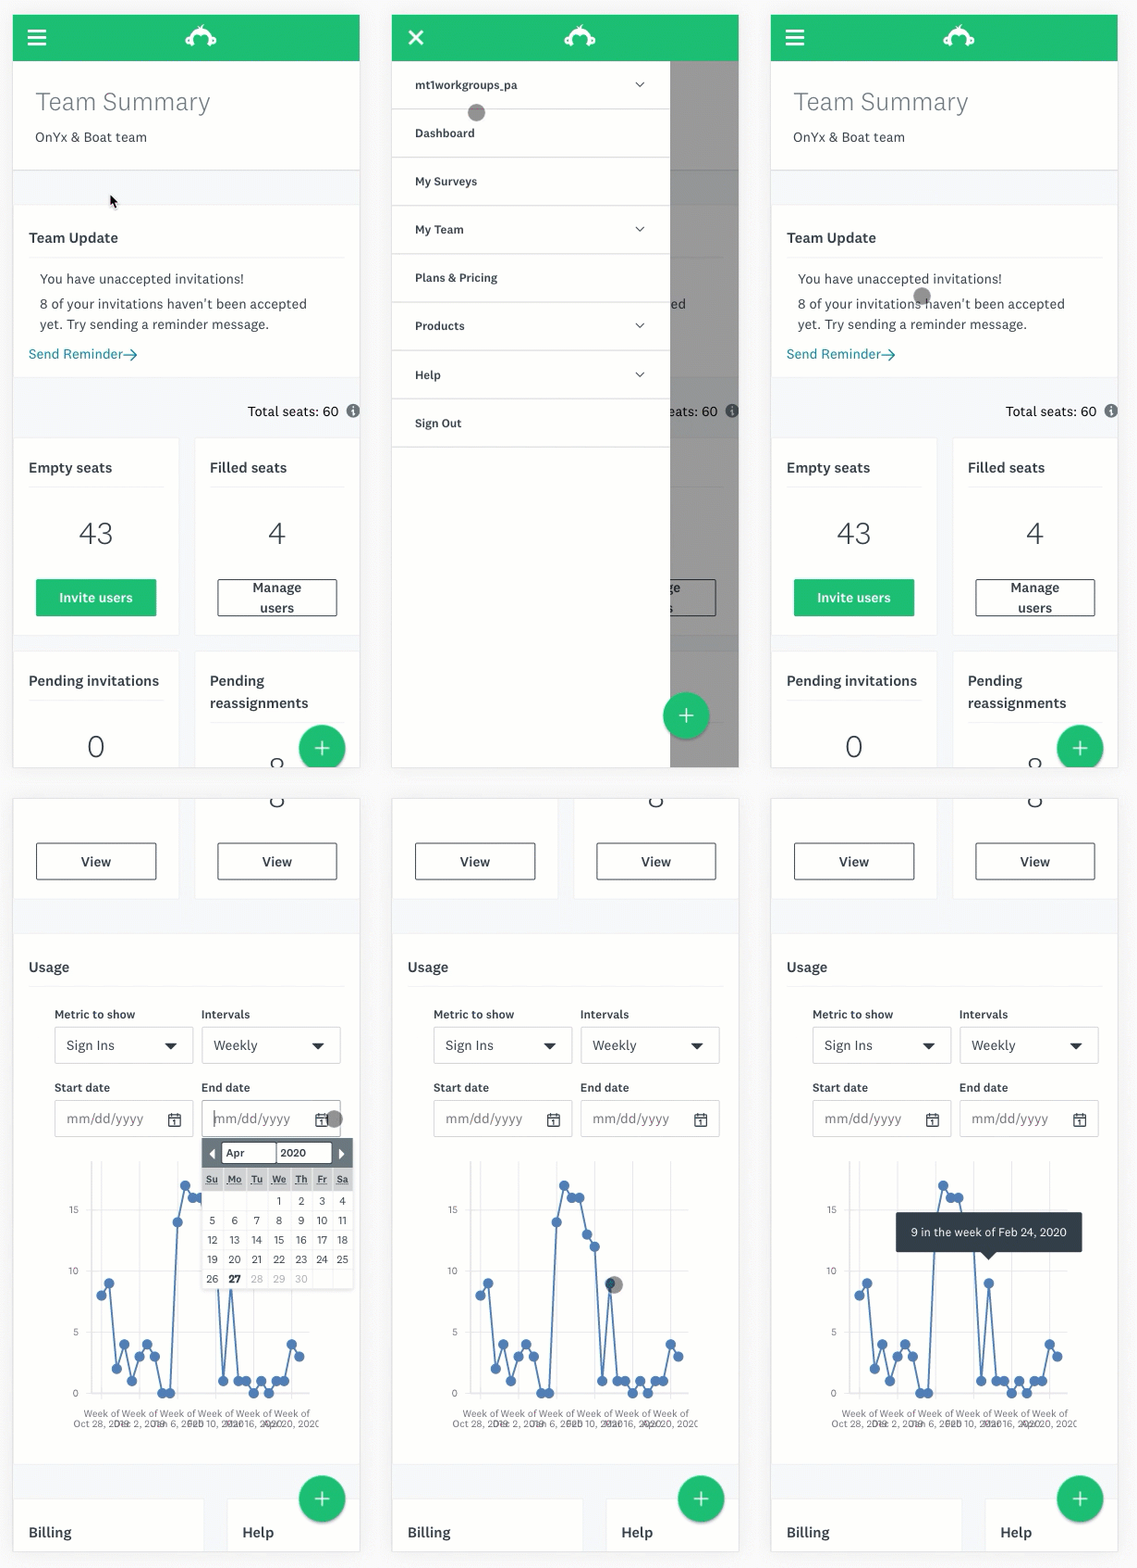
Mobile — every primary admin flow works from a phone
Collaboration at scale:
making teams visible.
By 2018, the enterprise foundation was solid. The next challenge was different: how do you turn a product built for individual survey-takers into one where teams actively leverage each other's work? Account data showed that 45% of accounts were being shared by more than one person. Users were forcing collaboration on a product that didn't support it, creating security and data integrity problems in the process.
The Collaboration at Scale initiative ran from mid-2018 through early 2020. It encompassed four interconnected capabilities, each of which I led design on as area lead.
People — from table to profile
SurveyMonkey had a visibility problem at both ends. Admins couldn't manage large teams efficiently, and team members couldn't see what their colleagues were working on. The same surface needed to solve two very different problems.
For admins: bulk management across teams of 25 to 7,000+, with rich filtering by status, role, collaboration mode, survey count, and response volume. Inline actions, bulk operations, and the precision of a tool built for someone whose job is managing people, not just a list of usernames.
For everyone else: each row in the table linked to a full profile: surveys created, workgroups joined, contact details. A researcher could search for a colleague, see what they'd already built, and reach out directly. Work that had been invisible became findable. Duplication gave way to connection.
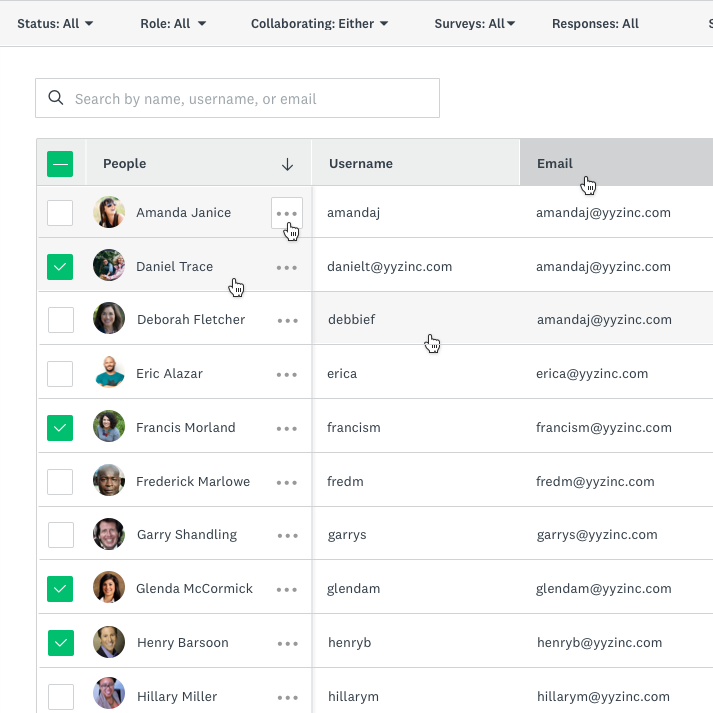
People management table — bulk selection, rich filtering, and per-row drill-down across teams of 25 to 7,000+ members. The same surface that gave admins control gave any team member a way to find a colleague and their work.
Workgroups — organizing around purpose
Teams don't organize around org charts; they organize around projects, functions, and shared goals. Workgroups let users form role-based groups with shared library access, survey permissions, and collaboration settings. Admins could manage workgroups from the console; members could self-organize within them.
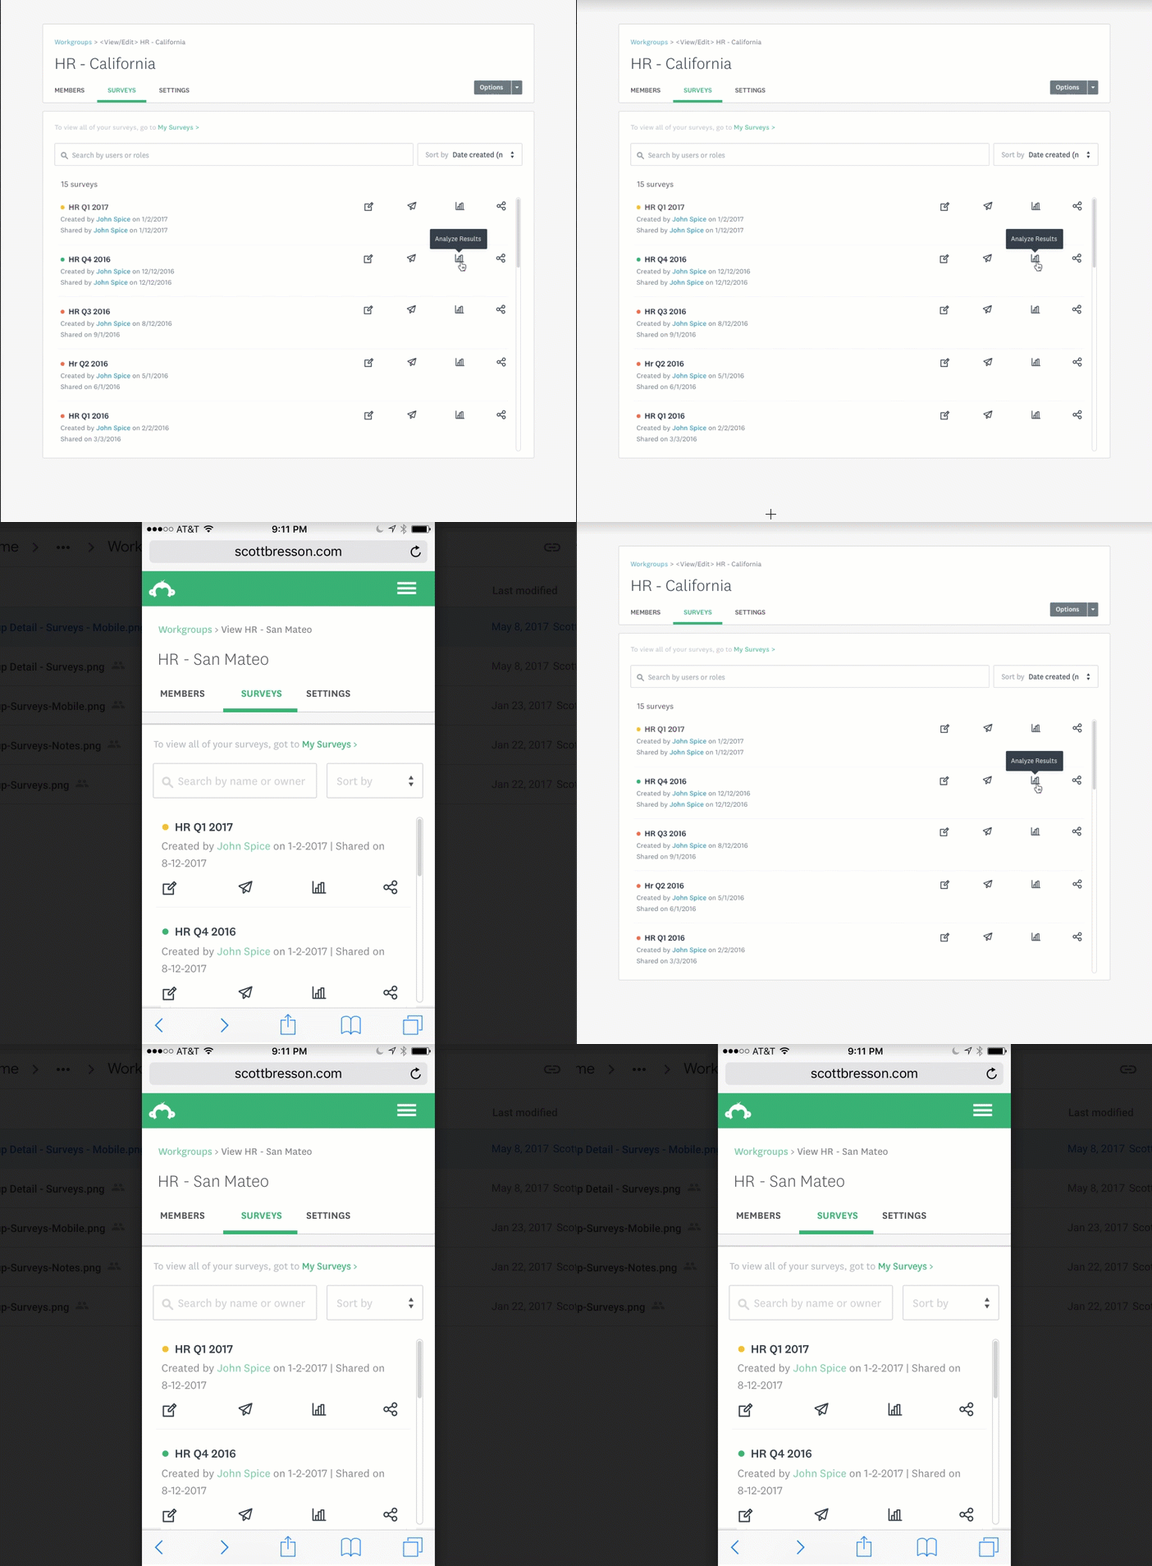
Workgroups — shared survey library with role-based access. Members see who created and shared each survey, with full action controls per item.
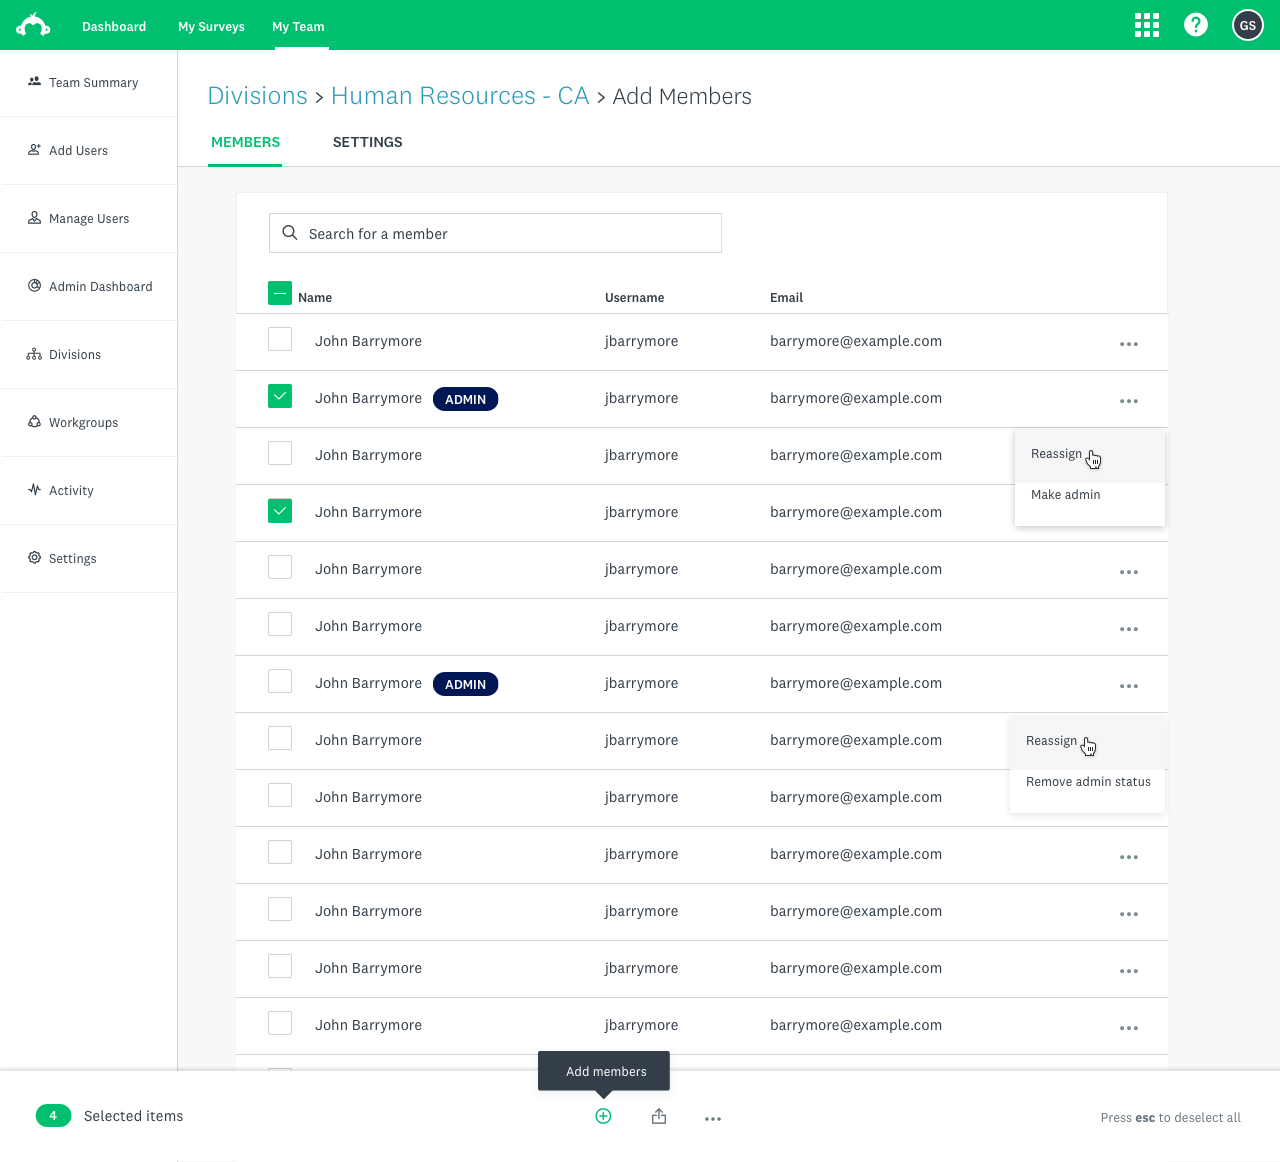
Divisions — department-level isolation with admin delegation and bulk member management
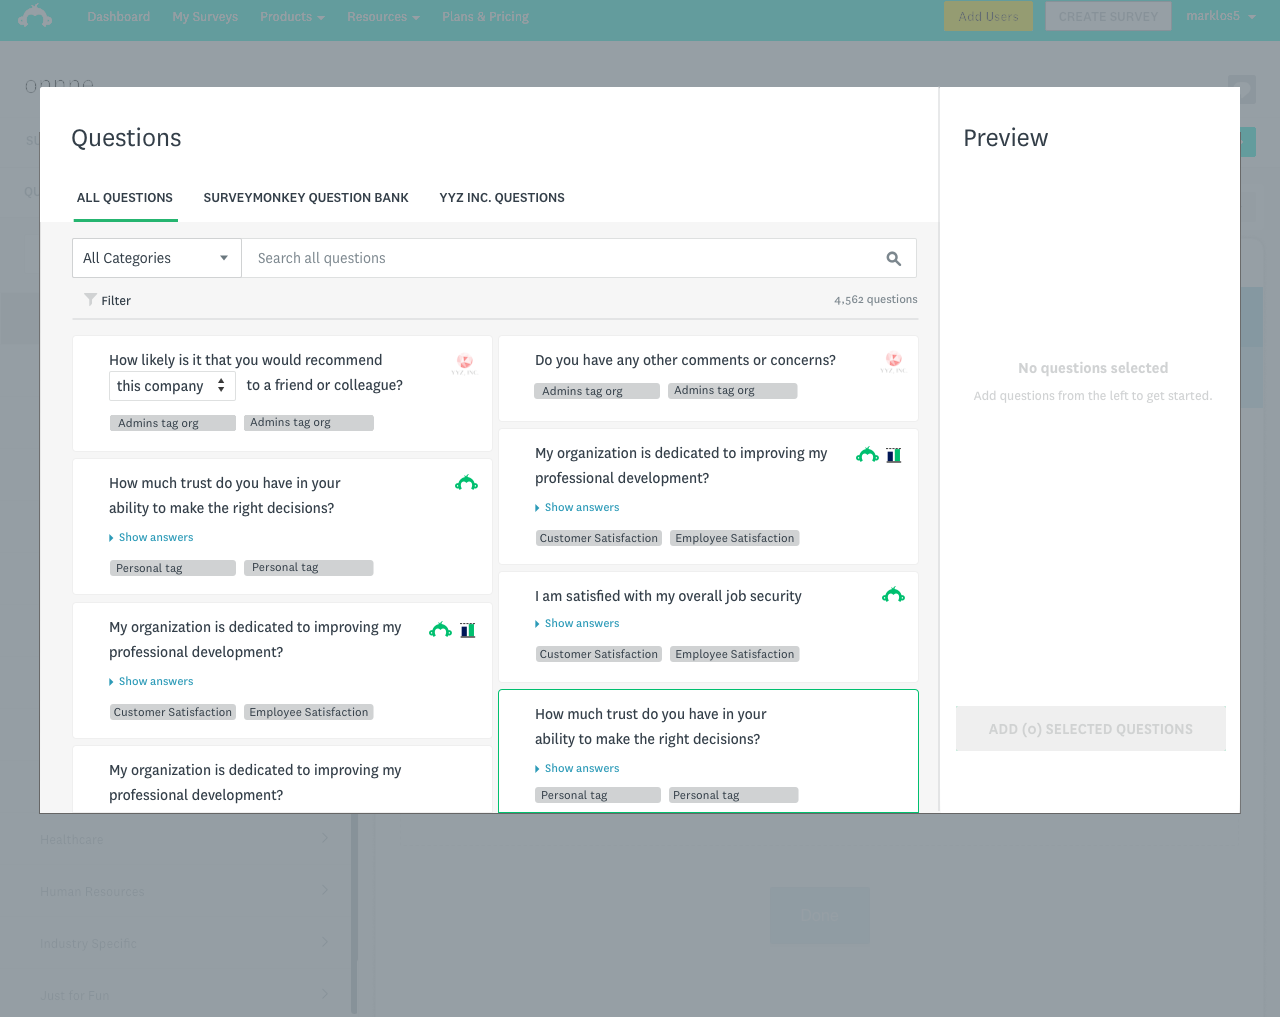
Custom question bank — org-wide standardized questions with category filtering and preview
Bulk sharing & transfer
Enterprise teams routinely needed to share hundreds or thousands of surveys simultaneously: onboarding a new team, offboarding a departing employee, reorganizing a division. The existing sharing model was built for one-at-a-time interactions. We designed a bulk selection pattern that scaled from a handful of surveys to an entire organization's library, with transfer logic that preserved access continuity.
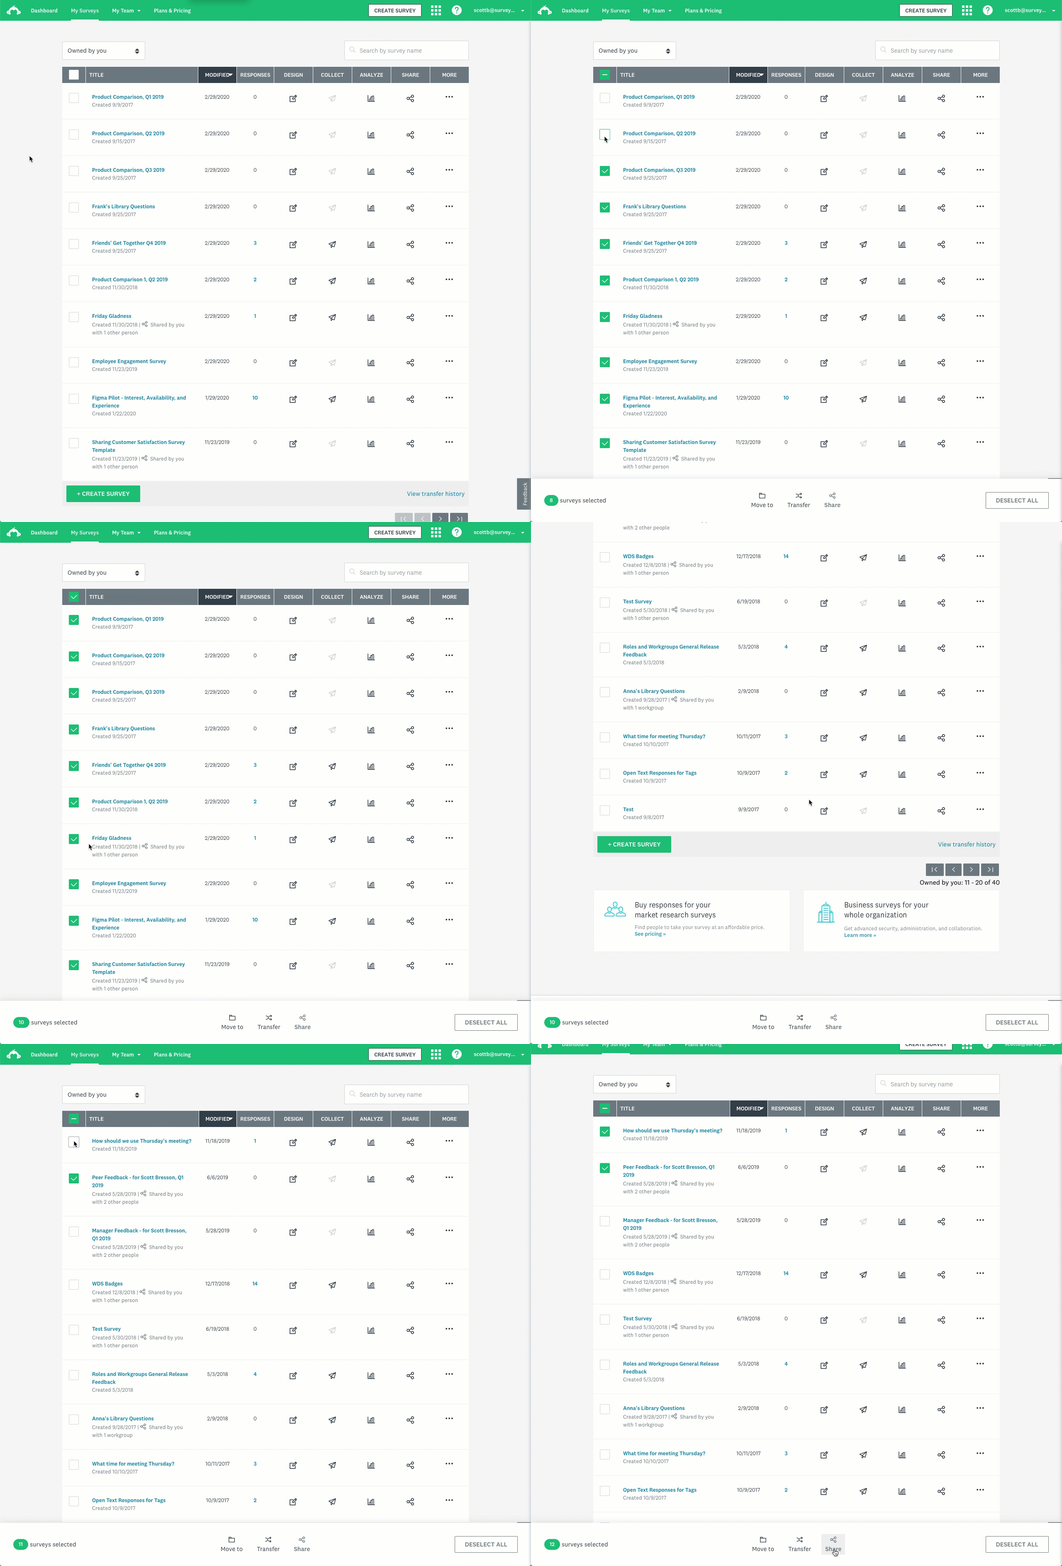
Bulk editing — survey management at scale with per-row actions and shared attribution. The table handles hundreds to thousands of surveys without losing clarity.
Account verification — security as a collaboration unlock
The credential-sharing problem wasn't just a security issue. It was a signal that the product didn't give teams a good reason not to share. Account verification added a security layer while also surfacing the collaboration features that made individual accounts worth having. We reframed the feature from "don't share your password" to "here's what you get when you have your own account."
We rolled out to a first cohort of high-sharers (10%) in July 2018 and completed full non-SSO rollout within 12 months. The flow was designed to preserve signup and upgrade paths throughout. Security couldn't cost the business conversions.
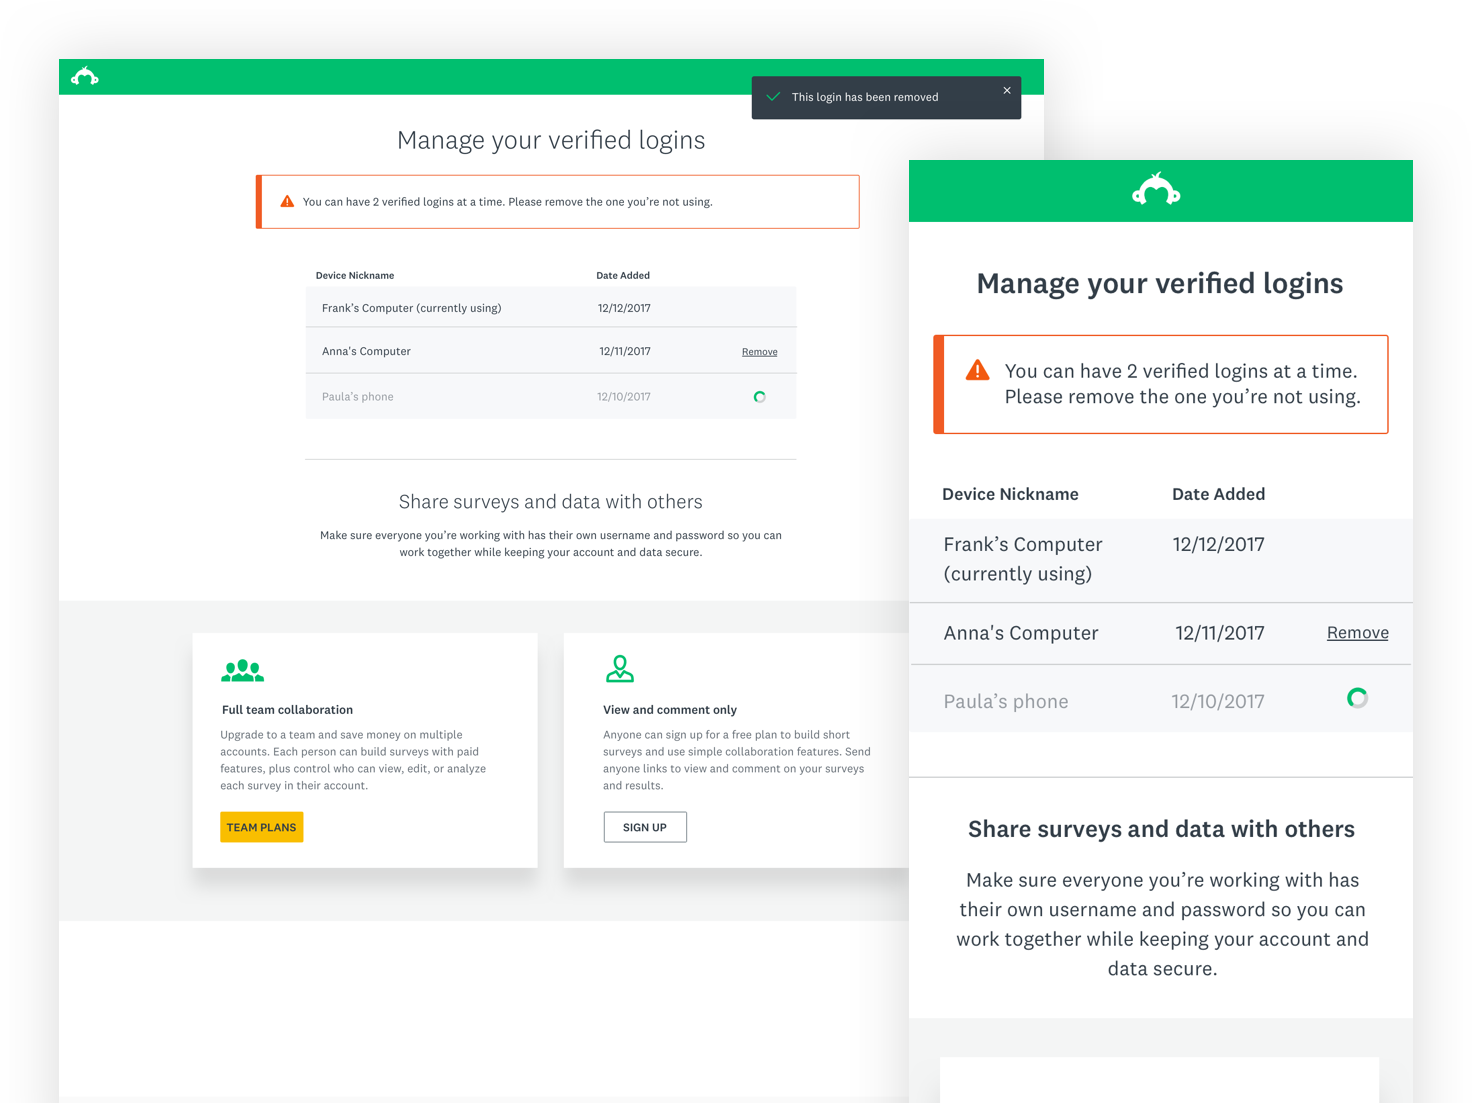
Account verification — verified login management (desktop and mobile) with collaboration upgrade prompt. The feature was designed to make individual accounts worth having, not just secure.
Operating at the
org level.
My title was Lead Designer and Area Lead. I had one direct report and a broad cross-functional remit. But the more accurate description of the role was design leadership at the intersection of product, business, and craft.
At a glance
Design leadership council. I sat on SurveyMonkey's design leadership council alongside managers, senior managers, and directors. This wasn't a liaison role. I was an active voice in org-wide design strategy, process decisions, and standards-setting. I advocated for enterprise design needs in conversations that often defaulted to the consumer product.
Design system adoption. The admin console project put us first in line to adopt the emerging design system. That meant contributing to it, not just using it. I worked with the design systems lead to define components that didn't exist yet, pressure-test patterns against enterprise data density requirements, and document decisions that other teams would rely on.
Cross-org workshop facilitation. Many of the hardest problems (account verification constraints, workgroup permission models, security vs. usability tradeoffs) required alignment across security, legal, marketing, customer success, and product. I ran the workshops that produced those alignments, translating between business requirements and user experience implications.
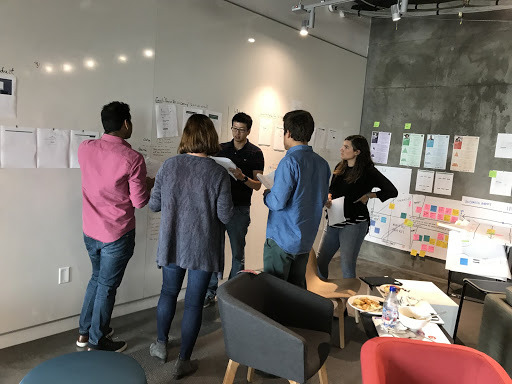
Cross-functional alignment session — working through the permission model and security constraints for the collaboration features with stakeholders across product, legal, and customer success
User research and persona development. Enterprise design at SurveyMonkey required deeply understanding admin archetypes: the IT Director managing 863 people across the org who just needs it to work, versus the HR Director who's running the surveys herself. I led the research work that produced our core enterprise personas, which became shared artifacts used across the product org.
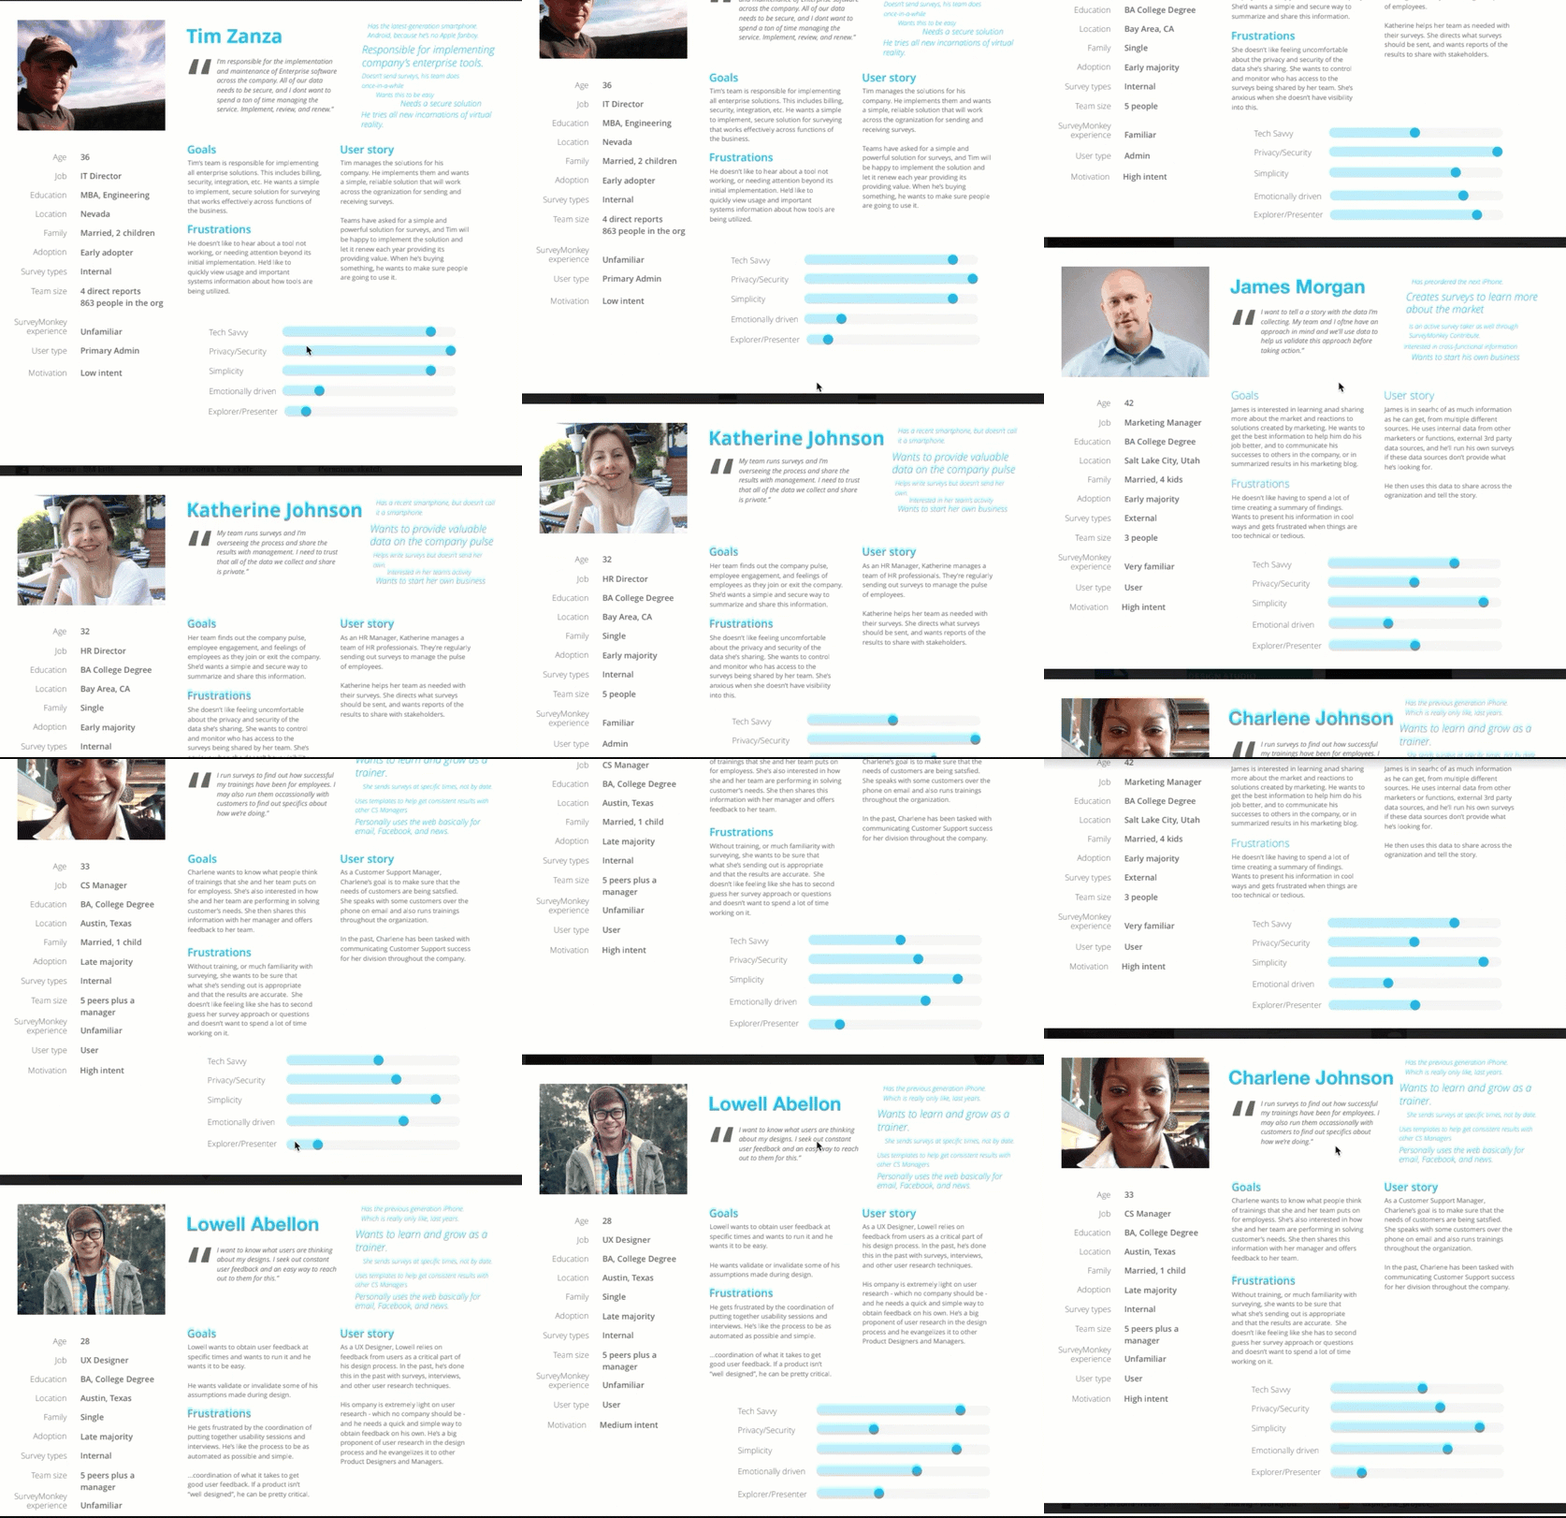
Enterprise personas — Tim (Primary Admin, IT Director) and Katherine (HR Director, power user) — built from customer interviews and used as shared design reference across the product org
Customer success partnership. I maintained a regular cadence with Customer Success Managers , monthly and quarterly, keeping enterprise user reality at the center of design decisions. Their input directly shaped the account verification rollout strategy and the People Pages prioritization.
"When I administer my team, I want the security, control, and monitoring that I need to make my team successful."
Core admin user story — developed from research, used as the guiding principle across all enterprise design work
What the work moved.
The results of four years of enterprise design work compounded, each layer enabling the next. The admin console made enterprise sales viable again. Collaboration features made team accounts worth having. Security features made the product trustworthy at scale.
Enterprise customers
From ~75 enterprise customers in 2016 to over 5,000 by 2020. Product-market fit found and scaled.
NPS improvement
A 20-point NPS gain across the four-year period, tracking directly with admin console and collaboration improvements.
Teams acquired in one year
Teams (3–25 people) acquired in the 12 months following the collaboration feature launch, the fastest team growth in company history.
Revenue above projections
Collaboration features generated $10M above revenue projections, with team LTV running 2× that of individual accounts.
Enterprise revenue arc
Enterprise at 11% of total revenue. Sales scaled back; the product couldn't support the teams being sold to.
Admin console shipped. New enterprise team established. Foundation in place for sales to grow again.
Collaboration features launched. Enterprise revenue reached 20% of total. 15–20% product growth in 2019 alone.
The biggest design lever wasn't the UI. It was making the case to build the right thing at the right time, before the business knew it needed it.
What I'd do differently.
The admin console HTML prototype was one of the best decisions we made, and also the most expensive one. Building a fully interactive, responsive, code-based prototype in 2016 took weeks of work that today would take hours.
I'd vibe-code it today.
In 2016, hand-coding the admin shell in HTML and CSS was the only way to test the things that mattered: navigation responsiveness, text expansion across languages, real device behavior. It was absolutely the right call. But the effort required was enormous.
Today, I'd reach for an AI-assisted prototyping tool and ship a testable prototype in an afternoon. The thinking is the same. The time cost is not. As a proof of concept, I rebuilt a version of the admin console prototype using modern vibe-coding tools. It captures the same navigation logic, data table patterns, and responsive behavior that took weeks to build in 2016.
View prototypeThe other thing I'd do differently: instrument earlier. We had strong qualitative signal from Customer Success throughout, but robust quantitative measurement of admin console usage came later than it should have. Starting the data instrumentation conversation in parallel with the design, rather than after launch, would have made our iteration cycles faster and our business cases stronger.